News
ICI Announced Research Results of "Türkiye's Top 500 Industrial Enterprises in 2018”
- 28.05.2019
- News

According to the "Türkiye's Top 500 Industrial Enterprises 2018" survey of Istanbul Chamber of Industry (ICI) that has been conducted for over a half century and composes the most valuable data of the sector, TÜPRAŞ is the leader with 79 billion TL production-based sales in 2017. Ford Automotive maintained its position in the second rank with their sales from the manufacture by 31 billion TL and Toyota Automotive maintained its position in the third rank with their sales from the manufacture by 23,6 billion TL.
In addition to the increase by 11 percent recorded by ICI 500 institutions in the export, increase in the share of the advance technology-oriented industries in the value added created and the number of the firms carrying out R&D caused hope. Financing costs of ICI 500 companies were seen to maintain their problematic nature like the previous years.
ICI Chairman Erdal Bahçıvan: “Turkish industry keeps its manufacture successively thanks to the knowledge and endurance capacity which it has in its own main activities even under the most challenging circumstances. Appearance in the financial tables will turn into positive in the medium term upon the manufacture economy and the support provided for it will gain more qualified nature day by day.”
The results of the "Türkiye's Top 500 Industrial Enterprises 2018" survey that Istanbul Chamber of Industry (ICI) had uninterruptedly conducted since 1968 and composes the most valuable data of the sector were announced. According to the research of “Türkiye’s 500 Major Industry Institutions” announced by Erdal Bahçıvan, the ICI Board of Directors Chairperson and İrfan Özhamaratlı, the ICI Board of Directors Deputy Chairperson at the press release organized, the top three institutions carried out the highest volume of export constituted by automotive firms. Accordingly, TÜPRAŞ took place at the top of the industry in 2018 with its sales from manufacture by 79 billion TL. Ford Automotive maintained its position in the second rank with their sales from the manufacture by 31 billion TL and Toyota Automotive maintained its position in the third rank with their sales from the manufacture by 23,6 billion TL.
According to the research including numerous information varying from Turkish economy, investment climate, to export and financing, especially the industry sector, net sales from manufacture which was 652,7 billion TL in 2017 of Türkiye’s 500 Major Industry Institutions increased to 878 billion TL in 2018 with a high growth performance by 34,5 percent. In addition to the price increases, the increase created by the increase in the exchange rates in the export incomes had a distinctive role at this swift growth. Real growth tendency maintained its existence in sales from manufacture in 2018; however, it decreased by 11,8 percent and stayed under the real growth which was 19 percent in 2017.
And while the total share of the top 50 of ICI 500 in the overall production-based sales was 50.2 percent in 2017 this rate increased to 50.6 percent in 2018. This increase pointed out that sales from manufacture of the top 50 institutions were growth swifter than that of the other 450 institutions. Activity profit rate of ICI 500 increased to 10,9 percent by improving by 1,3 score in 2018. Total activity profit’s absolute growth was 70,6 billion TL in 2017, it increased to 107,8 billion TL in 2018 with an increase by 52,7 percent. Increase in the activity profits was caused by the fact that the sales costs and activity expenditures increased in a lower speed than the net sales.
ICI 500 was announced during the press conference held in Odakule, and ICI Chairman Erdal Bahçıvan made a speech.
Distinguished Members of the Press,
Dear Guests,
We are gathered here today to share the results of the 2018 edition of “ISO- Türkiye’s Top 500 Industrial Enterprises”, Istanbul Chamber of Industry’s (ICI) long-standing survey that has been conducted continuously for the last 51 years.
As we begin our conference where we will add the yet another year’s data into this treasure trove of knowledge that has become the most valuable archive of our industry, our Deputy Chairman İrfan Özhamaratlı and I welcome and greet you on behalf of the Istanbul Chamber of Industry.
As you will remember, last year we reprinted and shared with you the first issue of our periodical, which was originally published back in 1968. We have done the same this year as well, and reprinted the second issue from 1969 in an effort to preserve our industry culture for posterity. You will find the reprint inside the dossiers you have been given. I would like to take this occasion to express my gratitude to everyone who has contributed to the studies and analyses that form this invaluable source of historic data for our economy.
The value of the ISO 500 surveys lies in their unique ability to provide a health check of their respective period. This is made possible by the breadth and depth of the survey, which includes information from a wide variety of areas from economic growth to investment climate, exports to finance, and especially industry. This is why disclosure of this information is highly anticipated by the press and the economic community.
As you know, in recent years we have made great effort to prepare and publish the study in the shortest amount of time. Because we know how valuable time is in today’s world. And accordingly, we endeavor to bring the information to those who need it as soon as possible.
With that being said, we would like to thank once again the enterprises who have helped bring forward the date of publishing by sharing their very valuable company information on time. Of course, collecting the information is not enough in and of itself. The most demanding aspect of the work is collating this information to create the “ISO- Türkiye’s Top 500 Industrial Enterprises”. I also thank our Economic Research Department, our consultants and our colleagues, for their meticulous analysis of this data that goes into the creation of this report each year.
Dear Members of the Press,
Before moving on to core data and company rankings of the ISO 500, I would like to highlight certain findings of this year’s study.
One of the key results of the study is the technology intensity of our industry. For years, data indicated that relationship between the industry and mid- and high-tech technology was weak, particularly with respect to value-added; yet, as of 2018, we are delighted to see a promising change that gives us hope for the industry’s future.
This is a valuable and meaningful change: mid-high-tech industries have increased their share in total value added from 20.2 percent in 2017 to 22.2 percent in 2018, and high-tech industries from 3.6 in 2017 to 5.3 percent in 2018. Yes, there is still a need for Türkiye to transform its industry towards high value-added and high-tech sectors, but the results are promising.
On the other hand, there is an inspiring increase in the number of ISO 500 enterprises engaged in R&D. According to 2018 results, there are now 276 ISO 500 enterprises engaged in R&D activities — the highest level since we began collecting and measuring this data.
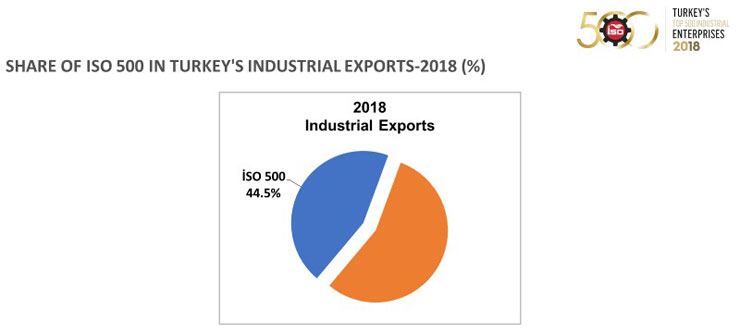
Another positive development in the ISO 500 this year is the export performance. In 2018, the export performance of the ISO 500 exceeded the overall export performance of Türkiye. During the year, Türkiye’s total exports and industrial exports grew by 7 percent, compared to ISO 500’s export growth of 11.3 percent.
The baseline production-based sales level of the ISO 500 rose from TL 309 million to TL 414 million. Accordingly, it is getting increasingly difficult for non-exporting enterprises to be ranked in the ISO 500, which includes 464 exporters now compared to 398 30 years ago. The share of these enterprises in Türkiye’s exports is also increasing continuously. This share rose from 41.1 percent in 2017 to 42.8 percent in 2018, while their share in industry exports grew from 44.5 to 42.8 percent.
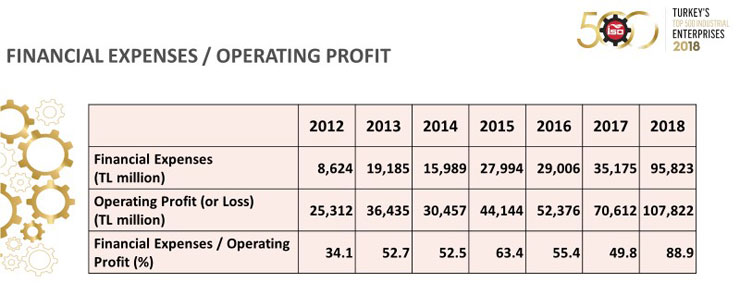
On the other hand, the study has revealed certain changes for the worse, which we, and everyone, should ponder over. One of such results, which we will later discuss in further detail, is the increase in financial expenses, which have accumulated over the years, and are growing exponentially.
As shown once again by the ISO 500, our industrial sector recorded a successful performance in terms of core businesses, sales, and core business profitability despite the challenges in 2018. However, this performance was not enough to offset the financing costs that were reflected in the financial tables.
Unfortunately, the scale of the disruption caused by financial expenses shows that the current trend is sustainable, regardless of how successful the enterprises are in their core businesses. As we will see shortly in figures, this financial disruption – an issue that has persisted for years – continues to upset the equity balance, making it more difficult for industrialists to access quality financing opportunities.
Dear Members of the Press,
Before moving on to the results of the ISO 500, I would like to review briefly the performance of our economy over the last couple of years.
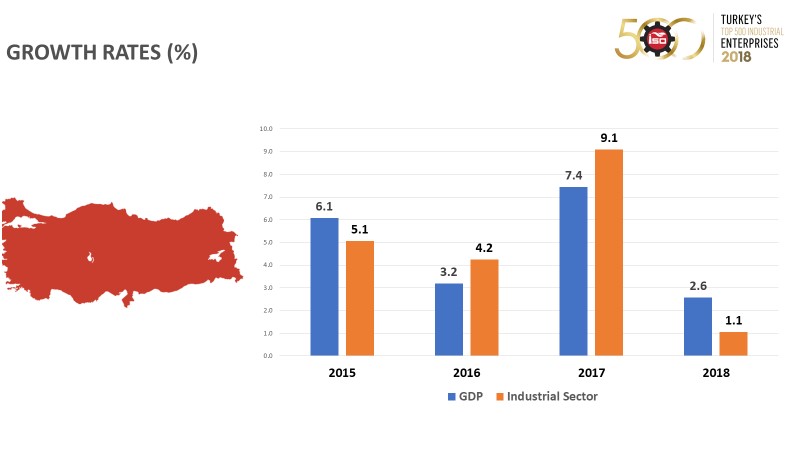
To sum it up: the last three years have been very challenging for our country. We have faced many obstacles that disheartened us, but still managed to overcome. During this time, we have successfully avoided the disaster scenarios presented for our economy. For this reason, the 7.4 percent economic growth in 2017, driven by the 9.1 percent support from the industry, was highly important.
As we entered 2018, the year of the ISO 500 study that we will cover in this meeting, we were optimistic and encouraged by this performance. The first quarter of the year supported this optimism. In the remainder of the year, however, the elections in Türkiye and tighter economic conditions in the world led to volatilities that affected Turkish financial markets. The escalating trade war between the US and China and Brexit were the key agenda items in the second half of 2018.
The impact of these developments is apparent in the growth figures. In fact, as can be seen in the table, the economy grew 2.6 percent in 2018, and the industrial sector’s contribution to this growth was 1.1 percent, which is quite low compared to the 2017 results.
The industry, in particular, was hit hard by the sharp decline in domestic demand. In addition, rising inflation and interest rates and the rapid depreciation in TL deteriorated financial structures of industrial enterprises and limited their operations. As a result, the industry shrank 6.4 percent in the last quarter of 2018.
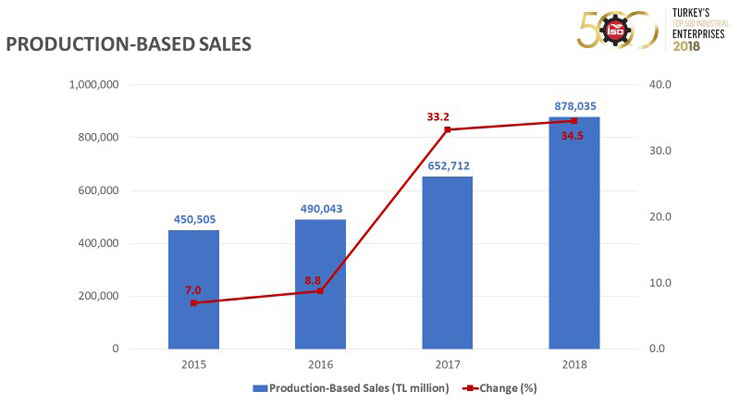
Now, I would like to go over the results. In 2018, the Top 500 Industrial Enterprises increased their net production-based sales by a remarkable 34.5 percent to TL 878 billion, up from TL 652.7 billion in 2017. The main factors behind this fast growth were the price increases as well as higher export revenues due to higher exchange rates.
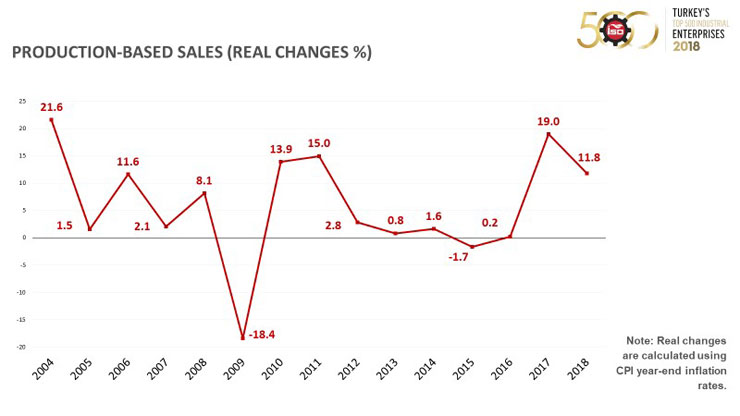
Looking at the production-based sales performance of the ISO 500 over the years, the weak growth in the 2012-2016 period was followed by a growth in real terms in 2017. While this real growth trend in production-based sales persisted in 2018, it was comparatively slower than that of the previous year. Real growth in production-based sales fell from 19 percent in 2017 to 11.8 percent in 2018.
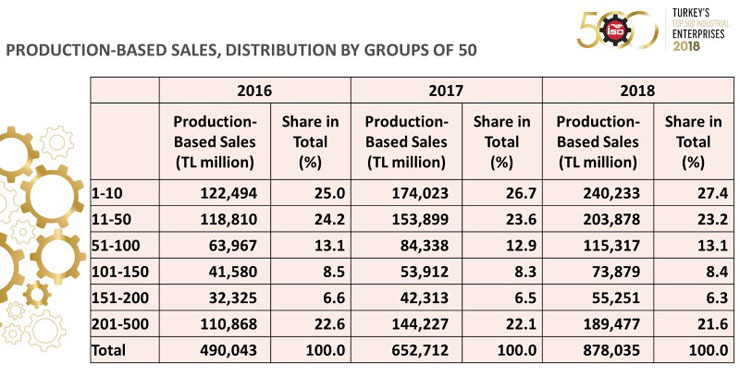
When evaluating the ISO 500 enterprises in groups of 50, it can be seen that the aggregate share of the top 50 in production-based sales climbed from 50.2 percent in 2017 to 50.6 percent in 2018.
This growth shows that the top 50 have outperformed the remaining 450 enterprises in terms of production-based sales. The share of the second top 50 in production-based sales has increased from 12.9 to 13.1 percent. Remaining groups still constitute a limited portion of production-based sales.
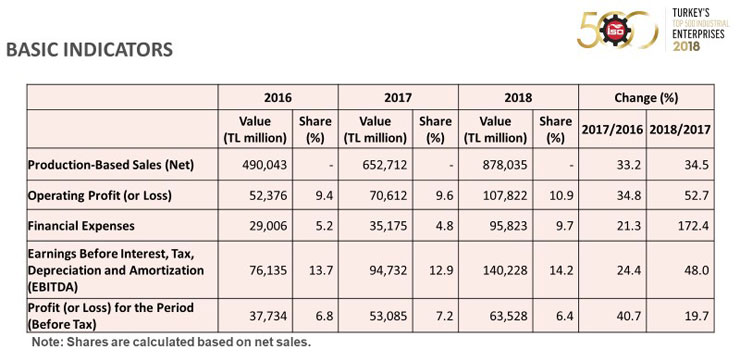
I will continue going over the basic indicators of the Top 500. In 2018, operating profits of the ISO 500 increased 1.3 points from 9.6 percent to 10.9 percent. Absolute total operating profits grew from TL 70.6 billion in 2017 to TL 107.8 billion in 2018 with a 52.7 percent rise. The reason behind this increase is a comparatively slower growth in sales costs and operating expenses.
In terms of EBITDA (Earnings Before Interest, Taxes, Depreciation and Amortization), which is an important financial indicator, it is apparent that in recent years, industrial enterprises have focused more heavily on their core business and operations, which has driven a stronger performance in EBITDA growth.
The same trend continued in the challenging conditions presented by 2018. In 2018, the ISO 500’s total EBITDA increased 48 percent from TL 94.7 billion to TL 140.2 billion, marking the highest EBITDA growth of the last six years.
Meanwhile, pre-tax profit and loss for the period grew 19.7 percent from TL 53 billion to TL 63.5 billion.
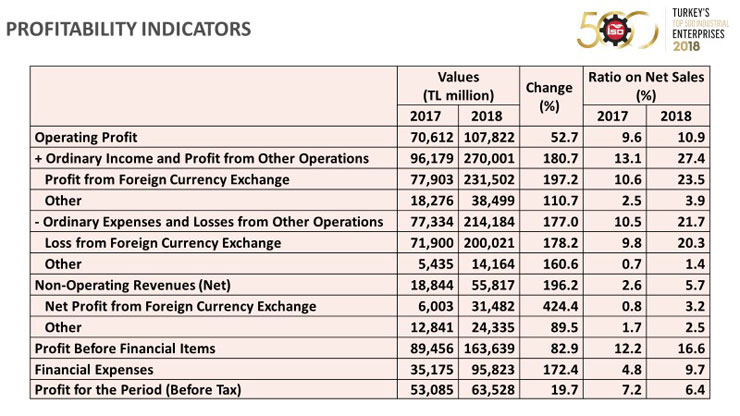
Looking at the profitability of the ISO 500, the Top 500 recorded TL 107.8 billion in operating profits in 2018. Ordinary income and profit from other operations was TL 270 billion, while ordinary expense and losses from other operations was TL 214.2 billion. In terms of sub-items, FX profits stood at TL 231.5 billion, while FX losses were TL 200 billion.
The difference between ordinary income and profit and expense and losses from other operations, the enterprises recorded TL 55.8 billion in net non-operating revenues. TL 31.5 billion of this figure came from net FX profits, while the remaining TL 24.3 billion was from a variety of items including interest, affiliate and dividend revenues.
I would like to make a point here. These figures are cumulative, and there are variations between enterprises based on their respective sectors. Certain companies have achieved immense FX profits, while others were faced with exceedingly high FX losses.
This is the financing issue plaguing the industrialists that I have mentioned in the beginning of my speech. Access to finance is a chronic issue with no signs of recovery in sight, and this is the most accurate picture of this problem.
In 2018, the share of ISO 500’s financial expenses to operating profits jumped from 49.8 to 88.9 percent. Meaning that while we used to complain about how high this figure was back when it was around 50 percent, in 2018, industrial enterprises had to spend almost the entirety of their profits on financial expenses. The surge in the financial expenses of industrial enterprises was due to the increases in both financial debts and financing costs in the second half of 2018.
This means that in 2018, financial expenses continued to be a key indicator of industrial enterprise profitability. The ISO 500 was affected by higher financing costs in 2018 due to sudden financial volatilities and shocks. The interest rate hikes and depreciation of TL in the second half of the year driving up inflation created a very challenging financial environment for the ISO 500.
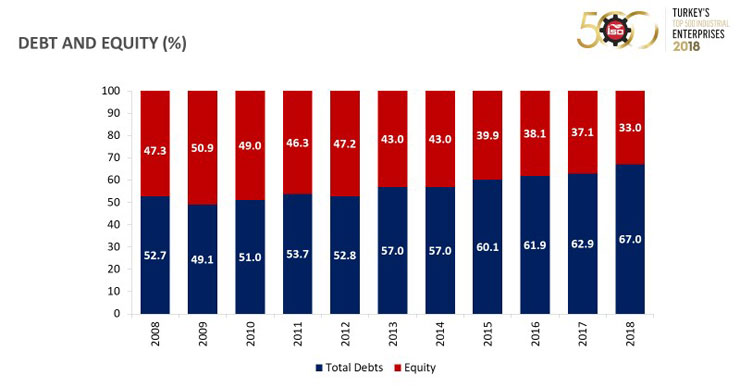
The distribution of debt and equity is one of the key indicators demonstrating the financial structure of enterprises.
The share of total debt of the ISO 500, after rising as high as 62.9 percent in 2017 grew a further 4.1 points in 2018 to reach 67 percent. While the share of equity fell from 37.1 to 33 percent. These figures represent the worst financial structure to date.
The increase in exchange rates is a key factor in the rising share of debt of the ISO 500. Another factor is the exchange rate hikes affecting the foreign currency debts of industrial enterprises, inflating the TL equivalents, and as a result, the share of debts. Consequently, the debts have grown higher even without an actual borrowing. The effect of the rising exchange rates was felt more heavily in 2018.
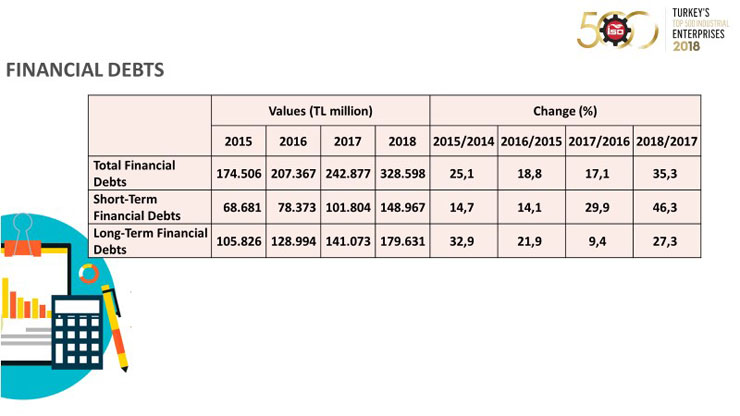
In 2018, the financial debts of the ISO 500 grew from TL 242.9 billion to TL 328.6 billion with a 35.3 percent increase. As a result, the growth rate of financial debts doubled compared to the previous year, maintaining the trend of real growth.
But more important is the growth trend in short-term financial debts. Short-term financial debts climbed 46.3 percent from TL 101.8 billion to TL 149 billion in 2019. In other words, there is a change for the worse in not only the borrowing rate, but also the maturity makeup of the debts.
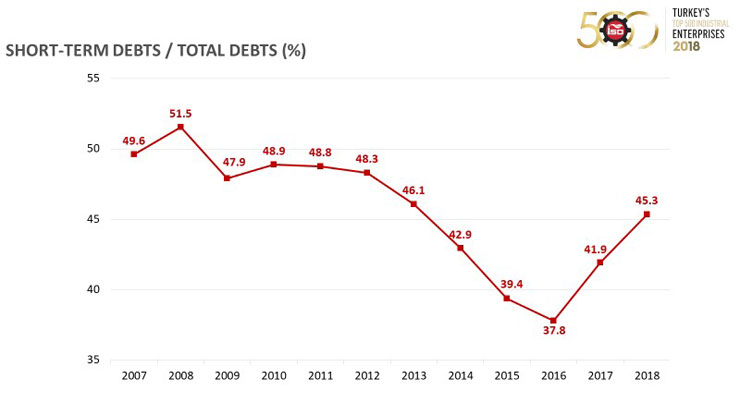
Since 2016, the share of short-term financial debt in total financial debt has been on the increase, climbing from 37.8 percent to 41.9 percent in 2017. As can be seen from the results of the 2018 study, this trend is still continuing, with short-term financial debt now accounting for 45.3 percent of all financial debt.
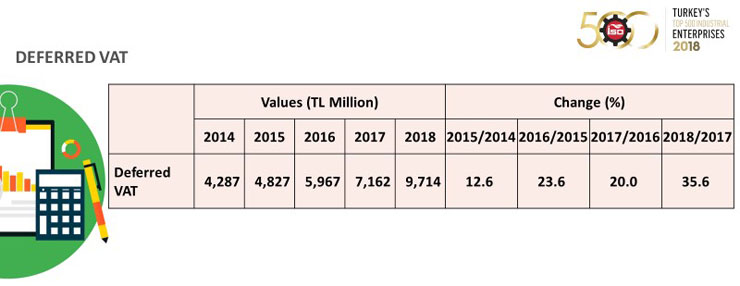
Another topic we have been mentioning frequently over the years is the "Deferred VAT” balances. According to the figures, the deferred VAT burden of the ISO 500 has continued to increase over the year. The deferred VAT burden of the industrialists has surged by a significant 35.6 percent over the previous year to reach TL 9.7 billion.
In a time of very limited access to sources of finance, and taking into account the figures we have seen earlier that point to the already significant financial burden of industrial enterprises, it would be fair to say that this massive amount is equivalent to a zero-interest loan given by the industrialists to the state budget.
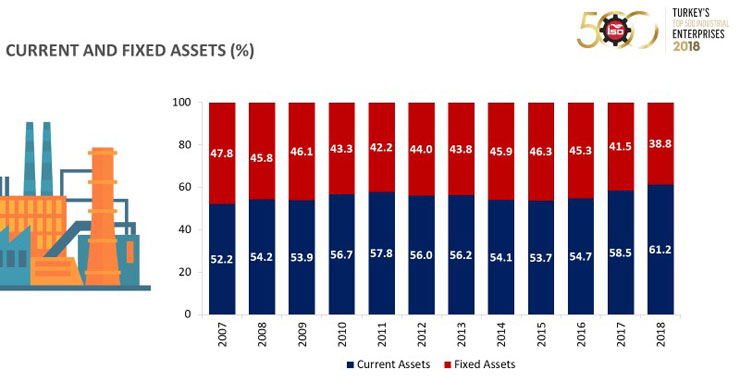
Another indicator that reveals the investment appetite of the industry is the relationship between current and fixed assets. High ratio of current assets to total assets has a positive impact on the management of working capital.
On the other hand, the regression in the share of fixed assets indicates a downturn in companies’ investment in fixed assets, or in productive machinery and equipment investments.
The ratio of fixed assets to total assets increased to 46.3 percent in 2015 before falling to 45.3 percent in 2016 and to 41.5 percent in 2017.
The 2018 data shows that the regression continued, with the ratio having fallen to 38.8 percent. In 2018, unfavorable developments with regards to the investment climate limited investments in fixed assets.
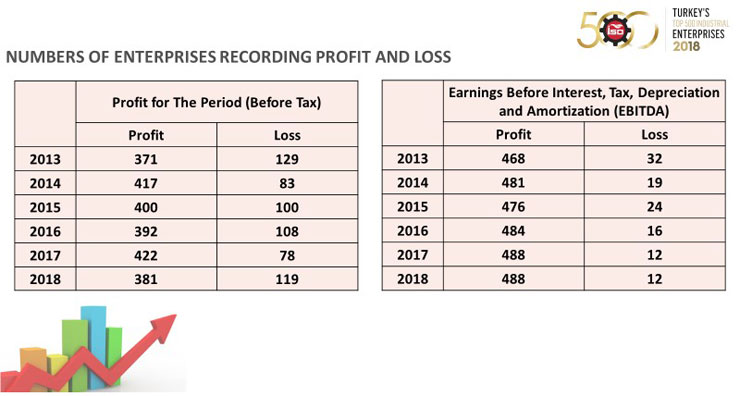
In 2018, the number of ISO 500 enterprises that recorded a profit dropped from 422 to 381, while the number of enterprises that recorded a loss increased from 78 to 119. The number of enterprises with positive EBITDA remained the same at 488 in 2018. This maintained result is also the six-year high of the survey, or in other words, since the inclusion of EBITDA as an indicator.
In 2018, companies continued to improve their EBITDA performance by focusing on their core business and operations. Industrial enterprises in particular were quite effective in maintaining their EBITDA despite the challenging demand and financing conditions.
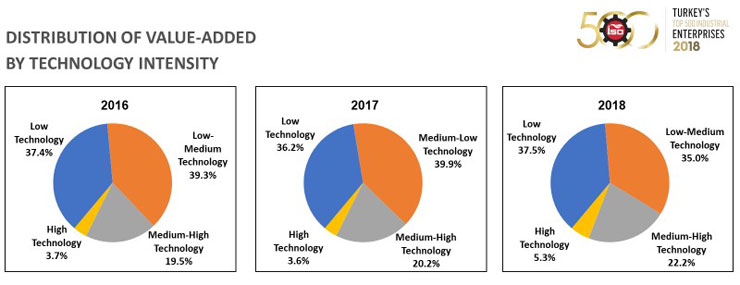
Now, allow me to talk about the most promising result of the ISO 500, as I have mentioned earlier in my speech. Looking at the breakdown of the ISO 500’s value added by technology intensity, low-tech industries have recovered their lion’s share in the value added generated in 2018 with 37.5 percent.
The share of mid-low-tech industries fell to 35 percent, down by 4.9 points in 2018. However, I am pleased to say that the share of mid-high-tech industries rose to 22.2 percent in 2018, up from 20.2 percent in 2017. Similarly, the share of mid-high-tech industries, which was 3.6 percent in 2017, climbed to 5.3 percent in 2018.
The share of value added generated by ISO 500 enterprises operating in mid-to-high-tech and high-tech industries increased to 27.5 percent in 2018, from 23.8 percent in 2017.
As such, while Türkiye still has to drive a transformation in its industry towards high value-added and high-tech sectors, this first, remarkable increase in the share of high-tech industries is one of the key findings of this year’s study. The main driver behind this growth is the major advances in defense and aviation industries in recent years.
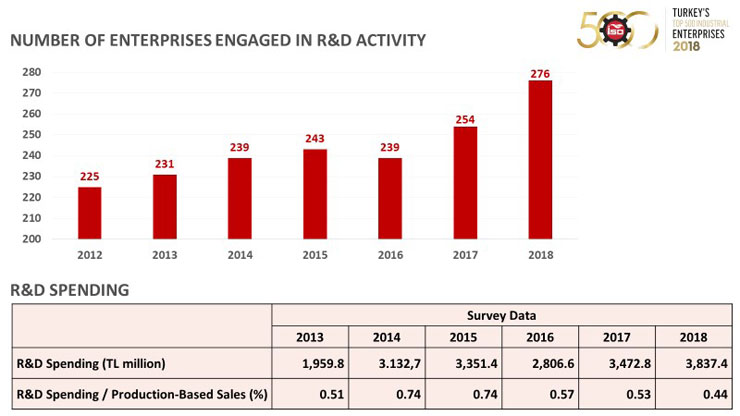
The number of ISO 500 enterprises engaged in R&D increased to 276 in 2018. This is the highest level since the inclusion of this indicator 2012.
It is encouraging to see that the number of enterprises engaged in R&D increased in 2018, despite the economic and financial challenges during the year. Likewise, the R&D expenses have grown 10.5 percent to reach TL 3.8 billion.
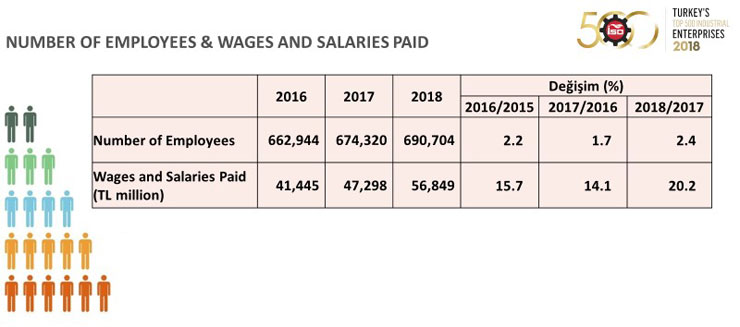
As with every year, the industrial sector continues to be one of the most important areas for employment and qualified human resources. Accordingly, changes in wages and salaries paid and the number of employees of the private enterprises in the ISO 500 serve as significant indicators.
In 2018, total employment of the ISO 500 climbed 2.4 percent. The increase in wages and salaries paid was recorded at 20.2 percent. This is an important indicator, showing ISO 500’s continued support for the employment.
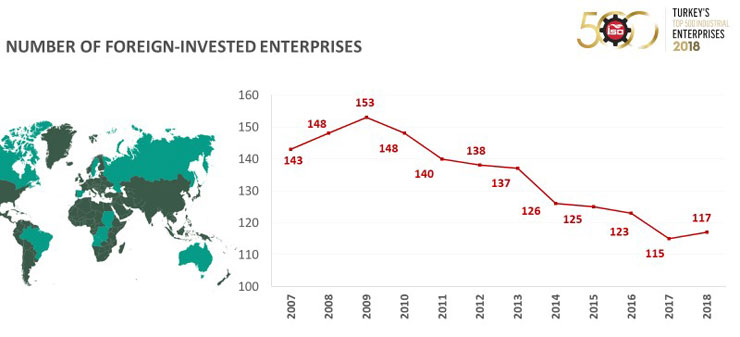
The number of foreign-invested enterprises in the ISO 500 showed a trend of increase in the 2000s, peaking at 153 in 2009. In later years, this count started to drop until it hit 115 in 2017. In 2018, however, two more foreign-invested enterprises entered the ISO 500, bringing the total to 117.
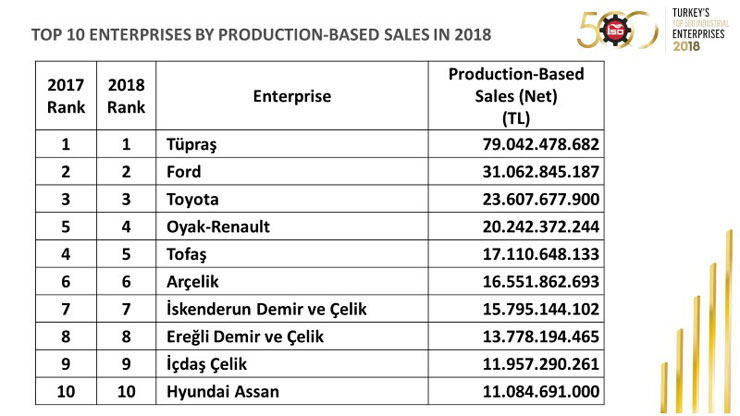
According to the ISO Top 500 Industrial Enterprises survey, in 2018 "TÜPRAŞ - Türk Petrol Rafinerileri A.Ş.” was once again the largest enterprise in terms of production-based sales with revenues amounting to TL 79 billion.
The second largest enterprise in terms of production-based sales in 2018 was “Ford Otomotiv Sanayi A.Ş.” with TL 31.1 billion, followed by “Toyota Otomotiv Sanayi Türkiye A.Ş.” with TL 23.6 billion. These two enterprises maintained their positions from the previous year.
In 2018, the top 10 enterprises based on production-based remained the same. The only difference in ranking of the top 10 was “Tofaş Türk Otomobil Fabrikası A.Ş.” falling one place to the fifth in 2018, and “Oyak-Renault Otomobil Fabrikaları A.Ş.” rising to the fourth place instead. Oyak Renault achieved fourth place with TL 20.2 billion, while Tofaş recorded TL 17.1 billion to get fifth place.
According to ISO Türkiye’s Top 500 Industrial Enterprises results, Arçelik took sixth place with TL 16.6 billion, while İskenderun Demir Çelik maintained its seventh place with TL 15.8 billion.
Ereğli Demir Çelik took eight place with TL 13.8 billion, followed by İçdaş Çelik at ninth with TL 12 billion, and Hyundai at tenth with TL 11.1 billion.
2018 was a distinct year in terms of exports. First, the growing prevalence of protection measures in global trade, particularly after the second quarter of the year, increased trade competition. In Türkiye, on the other hand, enterprises shifted towards exports due to the developments in the second half of the year and the sharp drop in domestic markets. As such, Turkish enterprises focused more heavily on exports in a time of rising competition in global trade.
Looking at the ISO 500’s export data under this light, we see that the ISO 500’s exports grew 11.3 percent in 2018, reaching USD 71.8 billion in trade value. Hence, the growth of the ISO 500’s exports surpassed the expansion of 7% in exports of both Türkiye and the industrial sector overall. As a result of this performance, the ISO 500 also increased its share in Türkiye’s industrial exports to 44.5 percent.
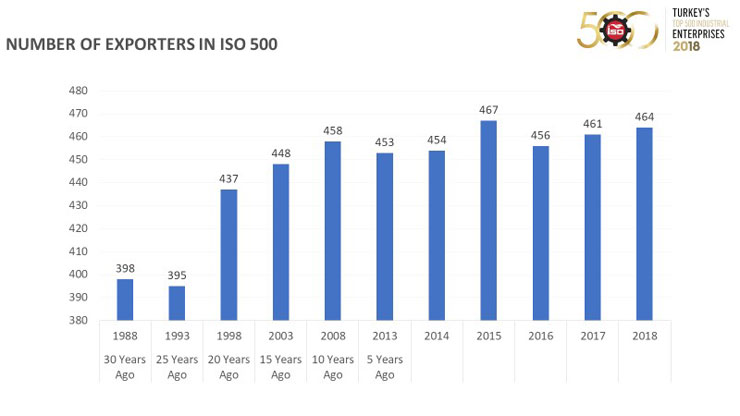
Another promising development is the rise in the number of exporters in the ISO 500. The number of exporters, which was 398 three decades ago, has crossed the 450 mark in recent years, finally reaching 464 in 2018. This result shows that exporting is now an important prerequisite for being ranked in the ISO 500.
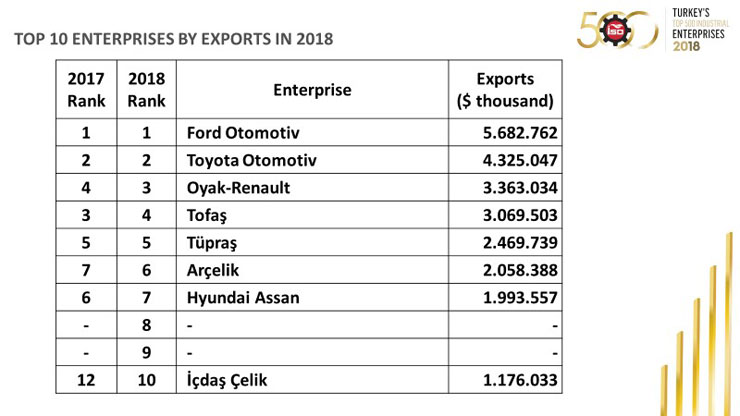
The top three exporters in 2018 were, in order, “Ford Otomotiv Sanayi A.Ş.” with USD 5.7 billion, “Toyota Otomotiv Sanayi Türkiye A.Ş.” with USD 4.3 billion and “Oyak-Renault Otomobil Fabrikaları A.Ş.” with USD 3.4 billion.
As it stands, automotive companies continued to dominate the top three in export rankings, same as 2016 and 2017.
Dear Members of the Press,
As I have mentioned earlier in my speech, the “ISO 500 Türkiye’s Top 500 Industrial Enterprises” study has provided, once again, a health check of the industry and the overall economy with its 2018 results.
The results I have shared are but some details from the larger report, which serves as a veritable indicator of the industry’s health, down to the minute details.
Based on this larger picture, our observations are as follows: Türkiye’s industry continues to utilize its expertise and resilience to successfully maintain production, even in the most challenging conditions.
This success is built upon the industry’s capability to export to four corners of the globe. Industrialists of different sectors are leveraging on this capability to hone their competitive edge against international competitors with each passing day. The fact that our industrialists are lacking the same financing opportunities with their global competitors makes this achievement even more valuable and meaningful.
We believe that with the growing importance of and continued support for the production economy, the discouraging results we see today, particularly in financials, will be replaced by more positive ones in the medium term.
As I close my speech, I would like to thank all of you once again for joining us here today as we revealed the results of this important study, and wish you a happy Eid al-Fitr in advance.