News
ICI (Istanbul Chamber of Industry) Announces the Results of the Türkiye’s Second Top 500 Industrial Enterprises Survey
- 22.07.2014
- News
Istanbul Chamber of Industry (ICI) announced the results of the Türkiye’s Second Top 500 Industrial Enterprises Survey today.
Istanbul Chamber of Industry (ICI) published the much anticipated second volume of the survey on Türkiye’s Top 500 Industrial Enterprises, announced to the public last month.
“Gamateks Tekstil San. ve Tic. A.Ş.”, which ranked 21st in the 2012 Survey, topped ICI's list of Türkiye’s Second Top 500 Industrial Enterprises with a turnover of TL 187 million 916 thousand as they soared net sales by 13,4% to TL 73,6 billion compared to last year.
“KİBSAŞ Karadeniz İnşaat ve Beton San. ve Tic. A.Ş.” which secured the second spot with production based sales (net) worthy of TL 187 million 697 thousand ranked 5th in the 2012 Survey. “Teksüt Süt Mamülleri San. ve Tic. A.Ş.” climbed to the third position on the list with an increase in net sales to TL 187 million 675 thousand.
Similar Results to the First Top 500
The survey revealed that the companies on the Second Top 500 list struggled with problems similar to those of the First Top 500 Industrial Enterprises. It is observed that the rise in total debt of 2013 had a major negative effect on the debt/equity ratio of the Second Top 500 companies. This, in turn, resulted in a decrease of 30,2 % in especially the total profit and loss before tax of Second Top 500 Industrial Enterprises which boosted their net sales by 13,4 % to TL 73,6 billion compared to 2012.
It should be noted that the Second Top 500 companies whose total debt in 2013 increased at 28,5 % and rose by 3 points compared to First Top 500 Industrial Enterprises, recorded a 61,8 growth in long-term liabilities in particular, which is two folds higher than of the top companies.
It is further observed that the Second Top 500 Industrial Enterprises felt deeply the impact of the financial cost of foreign exchange rate fluctuations last year as much as the First Top 500 Industrial Enterprises. The Second Top 500 Industrial Enterprises lost TL 2,7 billion, more than half of the total TL 5,4 billion of operating revenue recorded in 2013, in financing expenses.
Better Position in Exports and Technology
Exports by Second Top 500 Industrial Enterprises rose 3,7 % in 2013 to $10 billion. This figure indicates a relatively more successful performance as exports by the First Top 500 Enterprises fell by 0,7% to $63,3 billion. Exports of Türkiye dropped by 0,4% in the same year. Furthermore, it is a significant indicator that the rate of exports in the total sales of ICI Second Top 500 Companies in 2013 is 25,9%.
The rate of total exports by the Second Top 500 in overall exports of Türkiye was 6,4% in 2012 whereas the figure soared 6,6% in 2013. Exports by Second Top 500 Industrial Enterprises performed better than the average in Türkiye and the First Top 500 Industrial Enterprises. Relative competitiveness of Second Top 500 Industrial Enterprises is promising both for medium and long term. This picture also highlights the priority given to medium-scale companies in export subsidies.
Another area that Second Top 500 Industrial Enterprises apparently perform better compared to the First Top 500 is the use of technology. Advanced technology stands out with a rate of 4,6% in the added value distribution by technology use intensity amongst Türkiye’s Second Top 500 Companies. This rate was 2,6% in Türkiye’s First Top 500 Companies.
It will be useful to underscore several facts before analyzing the basic data regarding the Second Top 500 Industrial Enterprises. The most important fact is that the companies listed in the Second Top 500 Industrial Enterprises are medium-scale and aim for global competitiveness by growing into large-scale companies.
Within this framework, it is crucial that the economic conditions helping the Second Top 500 companies achieve the necessary scale growth exist. However, the policies aiming at economic balance, implemented especially in the last three years, do not create favorable conditions for the industry.
The 2013 results of Second Top 500 Industrial Enterprises affirm this finding. The Second Top 500, due to some negative economic circumstances, seem to have laid more emphasis on maintaining the current state rather than growth and scale gain.
The survey used the companies’ production based sales (net) as the sorting criteria. A detailed look at the survey starting from basic data to other noteworthy data reveals the following dramatic picture:
Cumulative Income Chart of the Second Top 500 Industrial Enterprises (2012-2013)
| 2012 | 2013 | Change (%) | |||
| Amount (TL) | Rate in Sales (%) | Amount (TL) | Rate in Sales (%) | ||
| Net Sales | 64.906.417.606 | 100,0 | 73.576.341.303 | 100,0 | 13,4 |
| Gross Profit or (Loss) | 10.262.665.368 | 15,8 | 12.783.602.338 | 17,4 | 24,6 |
| Operating Profit or (Loss) | 3.590.653.869 | 5,5 | 5.366.831.918 | 7,3 | 49,5 |
| Profit or (Loss) Before Financial Items | 4.750.879.054 | 7,3 | 4.749.437.660 | 6,5 | 0,0 |
| Financing Expenses | 1.562.991.377 | 2,4 | 2.716.300.642 | 3,7 | 73,8 |
| Pre-tax Profit or (Loss) for the Period | 3.161.026.692 | 4,9 | 2.205.786.931 | 3,0 | -30,2 |
In 2013, total sales of the Second Top 500 Industrial Enterprises reached TL 73,6 billion at a growth rate of 13,4%. On the other hand, their gross profitability increased by 24,6% to TL 12 billion 783 million. The operating income of the companies signals a good performance as well thanks to the 1,8 points increase in profitability compared to the previous year. The operating income showed a 5,5 rate in 2012 whereas this figure rose to 7,3% in 2013.
As is the case with the First Top 500 Industrial Enterprises, operating income of these companies gives the impression of an improvement. This is due to the fact that the Second Top 500 Industrial Enterprises experienced a growth slightly above inflation.
The first thing that comes to mind at this point is that this is an productivity-based growth. However, it should be noted that this is not the real reason behind. Financial experts attribute this to the positive impact of exchange rate growth on prices and therefore income statements, due to the imports of especially certain import-based basic raw material at lower rates before fluctuation.
When we take a closer look at the financial statements of Second Top 500 Industrial Enterprises, we observe that last year these companies covered their financing expenses by almost half of the profit they earned from their main fields of activity.
The Second Top 500 Industrial Enterprises had a total operating income amounting to TL 5,4 billion, more than half of which, TL 2,7 billion, was lost to financing expenses in 2013. In 2012, however, the Second 500 industrialists lost only TL 1,6 billion of the TL 3,6 billion operating income to their financing expenses. This clearly demonstrates what the financial turbulence and the political ebb and flow of last year meant for industrialists.
Changes in Basic Indicators (%)
| 2012 | 2013 | Change (%) | |
| Net Sales | 64.906.417.606 | 73.576.341.303 | 13,4 |
| Exports ($ 000) | 9.656.687 | 10.012.319 | 3,7 |
| Pre-tax Profit and Loss for the Period | 3.161.026.692 | 2.205.786.931 | -30,2 |
| Earnings Before Interest Tax Depreciation and Amortization | - | 6.932.684.146 | - |
| Total Debt | 34.281.941.987 | 44.044.549.978 | 28,5 |
| Short-Term Debt | 24.822.255.068 | 28.740.450.500 | 15,8 |
| Long-Term Debt | 9.459.686.919 | 15.304.099.478 | 61,8 |
| Financial Debt | 18.193.408.678 | 25.452.284.511 | 39,9 |
| Equity Capital | 25.672.540.648 | 27.915.782.558 | 8,7 |
| Total Assets | 59.954.482.665 | 71.960.332.572 | 20,0 |
| Interest Paid | 1.182.201.063 | 1.491.478.895 | 26,2 |
Financial fluctuations of the last year evidently had a negative impact on the entire balance of the companies. As a result of this, it is fair to say that the data on debt and equity relationship of especially the Second Top 500 Industrial Enterprises reflects a complete distortion.
Taking a look at the companies on the ICI 1000 list of 2013, we see that the debt ratio of companies rose compared to 2012 and the increase of the financial expenses led to a decline in their profitability. High levels of indebtedness and growing financing expenses added by low profitability further boost financing needs of companies leading to greater financial borrowing. This led to a shrinkage on the share of the companies’ equity in their asset portfolio, deranging their asset structure as well as their balance sheet.
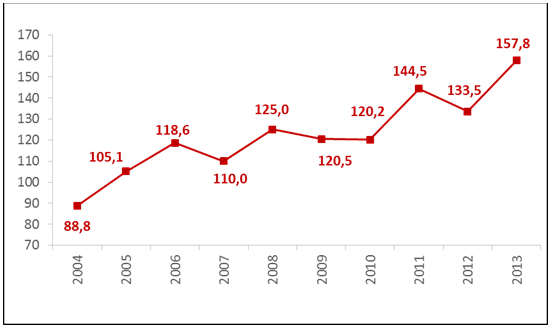
Debt/ Equity Ratio of Second Top 500 Industrial Enterprises
All this data manifests that ICI 1000 companies experienced a major increase in their financing needs to maintain their operations in 2013. It may be argued that the operating capital requirements of the companies may be decreased by optimizing assets and with an effective fund structure management.
Therefore, it is possible that strategic partnerships and sales of fixed assets will be sought in 2014. Additionally, just like the practice in the USA in recent months, big companies may make faster payments to smaller ones as a measure against the mentioned problem that is faced particularly by the small companies.
The rising financing requirements due to an increase in net operating capital and investments lead to a drop in profitability. Data from the Second Top 500 Survey suggests that such costs that could not be covered by the companies’ internal funds were covered mostly by bank loans leading to a higher debt consequently.
Thus, the debt/equity ratio of companies increased by 24,3 points in 2013 alone and rose to 157,8%. The total debt/ equity ratio which climbed to 144,5% during the rapid economic growth of 2011 and fell to 133,5% in 2012 due to economic slowdown, reached its peak for the last decade in 2013, as is the case with First Top 500 Companies.
The slowdown in profitability and equity generation contrasted by long-term borrowing options is in return causing to a rise in this ratio. The fact that the TL amount corresponding to the amount of foreign exchange borrowing increment due to the devaluation of Turkish Lira is another factor effecting this ratio. However, even when this impact is taken into account this ratio stands very high. It is known that this ratio is around 70 in developed countries.
Considering the results of the survey, it is observed that the total debt of the Second Top 500 Companies has increased’ as well. Total debt was nearly TL 34,3 billion in 2012 whereas it amounted to more than TL 44 billion with an increase of 28,5% in 2013. Their short-term liabilities rose by 15,8% whereas the long-terms ones grew by 61,8%.
This data does not signal healthy indicators for the financial structures of these companies.
Moreover, the industrial enterprises have failed to create sufficient internal funding through their own activities so as to increase their equity. Therefore, they have experienced approximately a 40% rise in their financial borrowing and concluded the fiscal year with a liability of TL 25,5 billion.
Debt ratios demonstrate that the financial liabilities to EBITDA ratio dropped to 2,48 from 2,53 for ICI First 500 companies whereas this ratio has soared from 3,3 to 3,7 for ICI Second 500 Companies.
Looking at the interest coverage of ICI companies, it is noted that the financing expenses/ EBIT ratio of the companies listed on the First 500 rose from 34% to 53% in 2013. The same rate for the Second 500 companies jumped from 44% to 51%.
In a climate where domestic savings dropped to as low as 12%, companies borrowed largely from abroad and their foreign debt rose considerably.
All these data prove that industrial enterprises experience major difficulties in profitability despite recording increased turnovers.
Debt/ Equity Relationship for the Second Top 500 Industrial Enterprises
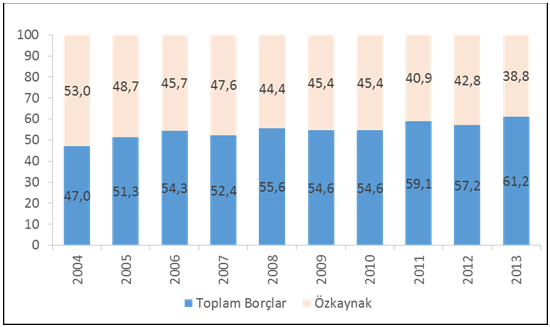
The share of the equity of ICI Second 500 in their total assets has been going into a decline since 2007 and dropped to 38,8% in 2013. The total debt to total assets ratio, on the other hand, rose to 61,2%. The financial structure of the Second Top 500 Industrial Enterprises indicates a negative outlook for their equity. Therefore, the balance of total debt/ equity is disturbed to the detriment of their equity. In 2013, the total debt/ equity ratio of ICI Second 500 companies soared as high as to 157,8%.
Second Top 500 Industrial Enterprises are at least as important as the First Top 500 Industrial Enterprises for the Turkish industry. This group includes new, innovative, competitive companies with a potential for global competitiveness in the future. The healthy growth of these companies is crucial. However, growth accompanied by an increased indebtedness does not point out to a healthy growth for the Second Top 500 Industrial Enterprises. Second Top 500 Industrial Enterprises have a higher need for equity.
This data inarguably reveals the financing burden on the industrial sector for the Second Top 500 Industrial Enterprises as is the case for the First Top 500 Industrial Enterprises.
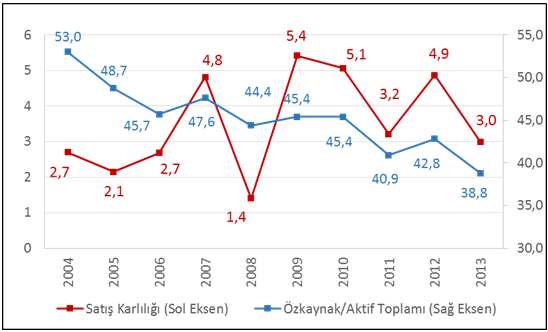
Nevertheless, our industrial enterprises unfortunately cannot get this funding from healthy sources. The results on this chart lay out that our industrialists prefer bank loans as their method of borrowing building up their financing expenses in a rather unplanned manner. Escalating financing expenses lead to a decline in profitability which in turn negatively affects equity growth of these companies.
As seen on the chart, the rate of profitability standing at 4,8 % in 2007 dropped as low as to 3% in 2013 whereas the equity to asset ratio fell from 53% to 38,8%. This ratio has been the lowest in this decade since 2004.
The sales costs to net sales ratio of ICI Second Top 500 Industrial Enterprises is 82,6%. Consequently they earned a gross sales profit of 17,4%. This rate is 1,9 points above the gross sales profitability of the First Top 500 Industrial Enterprises. The EBITDA/ sales revenue ratio of the Second Top 500 Industrial Enterprises is 9,4%. The Second Top 500 Industrial Enterprises achieve higher rates of profitability by focusing on their own field of business.
Nonetheless, these companies have not been as successful in the management of the risk arising from interest and foreign exchange fluctuations and operational productivity. The operating expenses to net sales ratio is 10,1%. Net loss on exchange to sales ratio is -1,3%. Financing expenses to net sales ratio is 3,7%.
High operating and financing costs along with the loss on exchange diminish high gross sales profitability. ICI Second Top 500 Industrial Enterprises reached a 3,0% profitability before tax. The Second Top 500 companies should attach further importance to productivity and risk management.
It is worth underscoring that an equity\ total assets ratio of 50% is a critical threshold. In developed countries and especially in countries where capital markets function more effectively, the equity ratio is as high as 60-70%.
Due to diminishing profitability and equities, auto-financing of companies slows down and more external funding is used.
One of the main reasons behind this situation is, as highlighted above, that these companies use bank loans as their routine borrowing method. Our companies unfortunately do not utilize debt instruments such as bonds, bills of exchange, public offering, long-term financing or hedging. They prefer to live on bank loans. It is sad to observe that our industrialists that perform highly in their spheres of activity are not as successful in receiving and utilizing funding.
On the other side, the global competitors to the Turkish companies use financing instruments other than bank loans more frequently. The rate of bonds and bills of exchange in the liabilities of companies in Türkiye is approximately 0% while the same rate is as high as 15% for global companies.
It should be reiterated at this juncture that the Development Bank of Türkiye should be rendered more effective in creating favorable financial solutions for the investments of the industrialists.
Low interest rates offer chief opportunities for companies borrowing on foreign exchange and the refinance transactions actively used in Europe and the USA are noteworthy for ICI 1000 companies to earn higher profits.
Profit-Making and Loss-Making Enterprises
| Pre-tax Profit and Loss for the Period | ||
| Profit (Total) | Loss (Total) | |
| 2004 | 406 | 94 |
| 2005 | 404 | 96 |
| 2006 | 414 | 86 |
| 2007 | 442 | 58 |
| 2008 | 342 | 158 |
| 2009 | 418 | 82 |
| 2010 | 442 | 58 |
| 2011 | 375 | 125 |
| 2012 | 417 | 83 |
| 2013 | 377 | 123 |
| Earnings Before Interest Tax Depreciation and Amortization | ||
| Profit (Total) | Loss (Total) | |
| 2013 | 460 | 40 |
When we take a look at the profitability of the Second Top 500 Industrial Enterprises in 2013, we observe that the number of companies achieving profitability has sharply dropped at the end of this fiscal year compared to last year.
In 2013, the number of profit-making enterprises in the Second Top 500 dropped from 417 to 377. The number of loss-making enterprises jumped from 83 to 123. Apart from the extraordinary circumstances created by the fluctuations in global markets in 2008 and 2011, this is the highest number of loss-making companies in the last decade.
Added Value Distribution by Technology Use Intensity
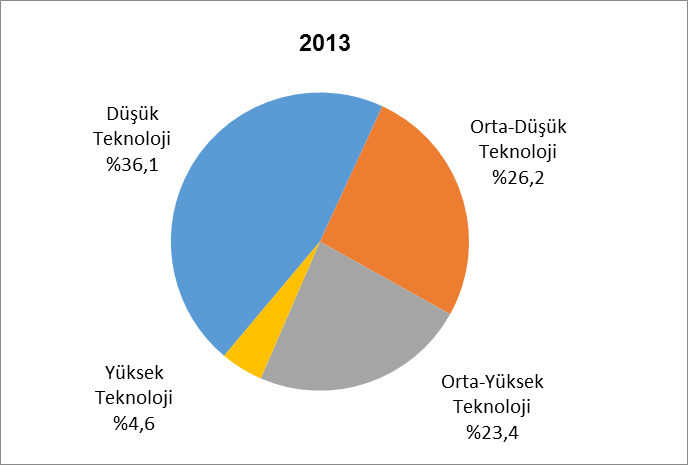
When we analyze added value distribution by technology use intensity, we observe that the added value we can create with the use of technology is not at a satisfactory level. The largest share amongst Second Top 500 Industrial Enterprises belongs to the low-technology industries with 36,1%, followed by the medium-low technology group with a rate of 26,2% and medium-high technology group with a rate of 23,4%. The share of high-tech industries stands very low with 4,6%, however it should be noted that this rate is better than the 2,6% rate of Türkiye’s First Top 500 Industrial Enterprises.
Türkiye has to tip these scales in favor of technology. Otherwise we cannot change the effect of this chart to profitability in industry.
On the other hand, the Second Top 500 Survey data points out that the companies on the Second 500 list will contribute more to the transformation of Turkish industry into a technology-intensive and higher added value one in medium to long term.
R&D Spending
| Income Statement Data | |
| R&D Spending (TL) | 171.810.394 |
| R&D Spending/ Production based sales (net) (%) | 0,27 |
Although data on technology seems more positive, the amount allocated by the Top 500 Industrial Enterprises for their R&D spending is very low as 0,27% due to financial constraints. International examples show that the R&D spending to sales ratio in developed countries is as high as 6-8%.
Number of Employees in Private Enterprises and Salaries and Wages Paid
| 2012 | 2013 | Change (%) | |
| Number of Employees (Persons) | 206.068 | 219.218 | 6,4 |
| Salaries and Wages Paid | 5.941.887.412 | 6.864.208.488 | 15,5 |
It is an undeniable fact that our industrialists continue to contribute to the social welfare of the country while trying to endure many problems. As is the case with the First Top 500, the Second 500 Industrial Enterprises increase employment in even their most difficult times. It’s also striking that they raise employee salaries above the inflation rate.
The 6,4% increase in the number of private sector employees and the rise of salaries by 15,5% are two particular indicators of the above mentioned fact.
TOP 10 Industrial Enterprises of 2013
| 2013 Ranking | 2012 Ranking | Enterprise | Public Ranking | Private Ranking | Production based sales (Net) (TL) |
| 1 | 21 | Gamateks Tekstil | - | 1 | 187.916.879 |
| 2 | 5 | KİBSAŞ Karadeniz | - | 2 | 187.697.319 |
| 3 | - | Teksüt Süt Mamülleri | - | 3 | 187.675.922 |
| 4 | - | Penti Çorap | - | 4 | 187.551.566 |
| 5 | 13 | Oğuz Tekstil | - | 5 | 186.641.067 |
| 6 | - | Felda Iffco Gıda | - | 6 | 186.208.460 |
| 7 | 58 | Yurtbay Seramik | - | 7 | 186.066.819 |
| 8 | - | - | - | 8 | - |
| 9 | - | Enka Süt ve Gıda | - | 9 | 184.551.969 |
| 10 | 79 | Kendirliler Haddecilik | - | 10 | 184.058.115 |
Distinguished Members of the Press
We would like to call your attention to a point before announcing the highest-ranking companies on the Second Top 500 list.
As the companies in the ICI Second Top 500 Industrial Enterprises survey are of similar scale; different companies top different charts based on indicators such as production based sales (net), added value, profit and exports. This trend, which is different from the ranking in the ICI First Top 500 Industrial Enterprises Survey, continued in 2013 as well.
“Gamateks Tekstil San. ve Tic. A.Ş.”, ranking 21st in the 2012 survey, topped the ICI Second Top 500 Industrial Enterprises list based on production based sales (net). “KİBSAŞ Karadeniz İnşaat ve Beton San. ve Tic. A.Ş.”, ranking 5th in 2012, holds the second position this year. The top third enterprise in production based sales (net) in 2013 is “Teksüt Süt Mamülleri San. ve Tic. A.Ş.”.
Only one enterprise ranking in the top ten list of production based sales (net) in 2013 was also one of the top ten enterprises of 2012.
Top 10 Most Profitable Enterprises of 2013
style="width: 100%;">2013 Ranking2012 RankingEnterprisePublic RankingPrivate RankingProduction based sales (Net) (TL)1-----2-----3229Dorçe Prefabrik Yapı-365.284.5284-----510Adel Kalemcilik-557.650.2986-----79BAŞTAŞ Başkent Çimento-748.950.7348-----911Alarko Carrier-947.696.8831020Çinkom Çinko Kurşun-1046.882.385The ranking in the ICI Second Top 500 Industrial Enterprises Survey is based on the companies’ profit before tax. There has been major differences on the list of highest profit-making enterprises compared to 2012. The top two highest profit-making enterprises of 2013 asked for anonymity. The third highest profit belonged to the company“Dorçe Prefabrik Yapı ve İnşaat San. Tic. A.Ş.”
Top 10 Exporters of 2013
| 2013 Ranking | 2012 Ranking | Enterprise | Public Ranking | Private Ranking | Exports (Thousand $) |
| 1 | 2 | Dorçe Prefabrik Yapı | - | 1 | 101.964 |
| 2 | 32 | Mioro Hediyelik | - | 2 | 90.777 |
| 3 | 7 | Unat Yağ | - | 3 | 83.047 |
| 4 | - | Göknur Gıda | - | 4 | 82.921 |
| 5 | 4 | Cevher Döküm | - | 5 | 82.127 |
| 6 | - | Progıda | - | 6 | 78.097 |
| 7 | - | - | - | - | - |
| 8 | - | Modavizyon Tekstil | - | 8 | 75.878 |
| 9 | 30 | Spot Tekstil | - | 9 | 74.916 |
| 10 | 10 | ATK Tekstil | - | 10 | 73.645 |
Another important ranking in the ICI Second Top 500 Industrial Enterprises survey is the list of enterprises with the highest export numbers. The top exporter of 2013 was “Dorçe Prefabrik Yapı ve İnşaat San. Tic. A.Ş.” This enterprise was second on the list last year and increased its exports by 3,9%. The second on the list is “Mioro Hediyelik Eşya San. ve Tic. A.Ş.” followed by “Unat Yağ Gıda San. ve Tic. A.Ş.”