The Study "Türkiye’s Top 500 Industrial Enterprises-2013" Announced
- 24.06.2014
- News

ICI (Istanbul Chamber of Industry) has announced today the results of the study ‘Türkiye’s Top 500 Industrial Enterprises-2013.’ According to the data made public by the chair of the Board of the ICI, Mr. Erdal Bahçıvan, Tüpraş has topped industry once again with a sales-from-production figure of 39 bn 729 million TRY. Türkiye’s top 500 enterprises have increased their net sales to 454 bn 900 million TRY with an increase of 7,4% from 2012.
With the majority of the biggest companies in petrochemicals, automotive, and steel and iron sectors, Ford Automotive has ranked the second in the study with its sales-from-production worth of 9 bn 714 million TRY where with a sales-from-production of 9 bn 263 million TRY EÜAŞ (Electicity Generation Inc.) has ranked the third.
The study ‘Türkiye’s Top 500 Industrial Enterprises’ that was announced by the Chairman of the ICI, Mr. Bahçıvan and his deputies, Mr. Adnan Dalgakıran and Mr. İrfan Özhamaratlı has revealed stunning data as to the gradually waning heft of industry in the overall economy. Accordingly, on the face of growth figures such as 2,1% and 4% in 2012 and 2013 respectively, the growth in the manufacturing sector has not risen above 1,7% and 3,8 % respectively for the same years. Emphasizing that the study reveals that growth stems not from production but consumption and the services and construction sectors, the chair of the Board of the ICI has continued:
 “Industrial sector constitutes the groundwork of economic growth and integrated development for all countries. Türkiye, no less, can attain a level of sustainable and quality growth and welfare only through production that is focused on ‘production.’ Since 2001 it is seen that the share of industry and especially that of the manufacturing industry within national income has been following a receding trend ending up in significant decrease when this is calculated with current prices. The share of the manufacturing industry within national income was 23,6% in 1998, which, through a steady decrease in the 16 years in between, has receded to 15,5% in 2012, touching base on 15,3% in 2013. The recess of this figure even before Türkiye has become an industrialized country is not a healthy development neither for the industry nor for the economy and Türkiye itself.”
The study has revealed that the companies’ debt and equity ratio has seen the apex of the last ten years in 2013, increasing, accordingly, by some 20,4 pts up to 132,4. This increase in a rate that is around 70s in developed countries was induced by the deceleration in profitability and the possibility of creating equities as well as long-term borrowing resources and the devaluation of the TRY.
Companies have opted mostly for bank loans as a result of insufficient equities, increasing their financing costs in an unplanned fashion. Of the companies the profitability of which has gone down, the equity growth was also negatively impacted. Mr. Bahçıvan, the ICI chair, has also underlined the fact that the level of 50% as the share of equities in the overall actives is a critical threshold.
 Bahçıvan continued: “Unfortunately, our companies do not make use of borrowing instruments such as bonds, notes, public offering, long-term financing and hedging. It is equally unfortunate that our companies with their outstanding performance in their respective fields cannot demonstrate the same success in securing and use of finances. Thus, the Development Bank of Türkiye has to be made more functional so as to design tailor-made financing solutions for the industrialists. That is one need I wish to underscore.”
One of the stunning data to emanate from the 2013 study was that the companies would spend more than half of their profits out of their main activities to financing costs. These companies’ profit from their own activities was 36,5 bn TRY in 2013, 19 bn TRY of which would be spent as financing costs; today their term profit for 2013 has decreased by half in comparison with the previous year, receding as low as 4,9%.
Among the 500 top Big Enterprises of Türkiye the highest added value was generated by the low-and medium level tech-intense group of industries by some 43,6%, followed by the low tech-intense group of industries by 36,1%. Reminding that share of the former group was 17,8% and the latter 2,6, Mr. Bahçıvan also underlined that the share of the high-tech-intense sectors within the overall global manufacturing industry was an average of 16,7; and continued: “The same figure for South Korea is 21,6%, 49,9% in Singapore and 20,6% in the USA. Türkiye must turn these figures around in favor of technology. Otherwise, we will not be able to make any changes to the repercussions of these figures on the profitability of the industry.”
Putting an emphasis on the increase of 6-8% in the ratio of R&D to sales for the companies in developed countries, Mr. Bahçıvan, said that the same number in Türkiye is 8 per thousand; hence the Top 500 companies are lagging well behind Türkiye’s average, allocating a mere 47 per thousand of their sales from production to R&D.
Focusing on respective data and charts, Mr. Erdal Bahçıvan, the ICI chair, has also made the following evaluations during his announcement of the top 500 Industrial Enterprises:
 “We have gathered together here today, once again, to share among us the results of a study that is one of the most effective and reliable references for many economic research and studies in Türkiye.
First and foremost, I would like to welcome everyone to this event in person and in the name of the İstanbul Chamber of Industry with my friends who are at the same time deputy chairs of the ICI, where we will announce the results of the study “Top 500 Industrial Enterprises of Türkiye-2013.”
We used to make this announcement about our study in July; however, we had to act a bit early this year as we hereby make this very same announcement in June this year. Today, information an time are so precious as everybody would agree and we are confident that this endeavor of ours will also be appreciated by the public.
I would like to extend our Research Department and our Media and Press Department our thankfulness for their support in the materialization of this success; then to the members of our team and our consultants, and most importantly to the most valuable companies of the Turkish industrial sector who, just like every previous year thus far, have attended and responded to our questionnaire, sharing their data with us.
The very first of these reports, like the one that we have handed out to you here today, was prepared 46 years ago, in 1968. Our research initially covered 100 companies. The scope, later, was extended to cover some 300 in 1978 and since 1981 it is being shared with the wider public under the name and with the scope of the ‘Top 500 Industrial Enterprises of Türkiye.’
This study, since the first day it was published has been a crucial archive material for our Republic and for our economy and companies. We will continue to serve in this fashion, enriching and enlarging this archive into the future.
A variety of cycles from scholars to journalists, from business people and bureaucrats to researchers cannot wait to get a hold of this report every year.
There are important reasons behind this fact. The study ‘Top 500 Industrial Enterprises of Türkiye,’ above all, is a mirror of the most realistic and current visage of the real economy thanks to each and every single succulent issue ripe with data. Each and every issue adds up on the previous ones, leading to a deeper pool of information on the ‘Top 500.’
Before moving on with the most anticipated rankings of our study, I would like to touch upon some facts from this year’s research concerning the actual status of the Turkish industry, its current structure and direction.
This study concurs with a fact that we have long been pressing our finger on; and it does so once more and with clarity. That is, our industry today, is far from what we deserve both for today and for our future.
Growth Rates (%) (Economic Growth, Growth in the Manufacturing Industry, Manufacturing Industry/GDP)
| 2012 | 2013 | |
| Economic Growth | 2,1 | 4,0 |
| Growth in Manufact. Ind. | 1,7 | 3,8 |
| Manuf.Ind./GDP | 15,5 | 15,3 |
Yes; for the last fifteen years, our industry is losing its impact on our overall economy. This fact that has persisted in the previous years, it seems, has evolved almost into a trend. And the figures for 2012 and 2013 are also indicative of the fact that this trend lingers.
Even looking just at these two years the reasons for this is evident. Growth in our manufacturing industry in the last two years where economic growth was 2.1% and 4% respectively, was 1,7% in 2012 and 3,8% in 2013.
These data are indicative of the presence of a growth in Türkiye that is not based on production but that is rooted rather in consumption and in the services and the construction sectors whereby we are falling further away from production.
It is high-time now, that we, all of us must see this cycle where we are getting further away from production and we must endeavor to break this cycle, work hard to rewind it, because the industrial sector for all countries is the bedrock of economic growth and integrated development. Türkiye, no differently, can achieve a quality and sustainable growth and welfare that is based on production only with a focus on production.
The Share of the Manufacturing Industry in the GDP (%)-with current prices
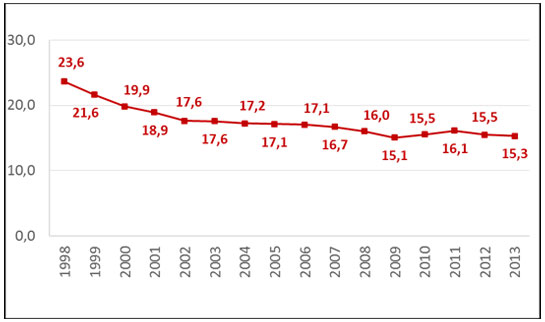
This is the picture where we see that we are falling apart with production. Please note the relatively stable conditions that had formed during the economic recovery and normalization that followed the economic crisis in 2001. Yet, this table shows us that this chance was not turned into an opportunity for our overall economy and industrial yield.
Since 2001 the share of industry and especially that of the manufacturing industry within the national income is seen to follow a receding trend and has decreased considerably when calculations are made on the basis of current prices. The share of industry within the national income in 1998 was 23,6% and through a steady decline during the 16 years in between it has receded back to 15,5% in 2012, reaching 15,3% in 2013.
That this rate is receding before Türkiye has become a developed country is not a healthy development neither for the industry nor for the economy and nor for Türkiye itself.
For this reason, as the İstanbul Chamber of Industry we, as we have always said, believe that the only way out of this cycle is through, not consumption but an integrated development perspective that stems from production. We must reiterate here, once again that we must strive for such a model of growth.
The history of the Turkish economy in the recent past is being written –literally- on the space in the clasp of growth and current deficit, which in return has negative repercussions on growth and on especially that of industry.
As we have always emphasized, financial stability is our basic priority that we must care about and protect the most. Maybe the most remarkable thing about this year’s Top 500 Industrial Enterprises study is that it reveals this fact before our eyes, once again, in all clarity.
The chart that is on the screen right now demonstrates a brief summary of the cumulative income grid of the Top 500 Industrial Enterprises. As you well know, since the second half of 2013 the Turkish economy has experienced many serious financial ebbs and flows. The foreign exchange rates have yawed through wide oscillations following that the stability of interests has deteriorated significantly.
We can see that during these oscillations –long and wide- the companies, in order to pull the gross sales profitability up have toiled as a result of the stress of profitability and competition. However, because of the financing stress, it is still debatable to what extent they have succeeded in this.
To be honest, it seems that our industrialists have succumbed to the financing stress as a result of the stress from the exchange rates and interests.
The Cumulative Income Grid of the Top 500 Industrial Enterprises (2012-2013)
| 2012 | 2013 | Variation | |||
| Total (TRY) | Share acc. to sales | Total (TRY) | Share acc. to sales | % | |
| Net Sales | 423.621.059.525 | 100.0 | 454.990.900.780 | 100.0 | 7.4 |
| Gross Profit from Sales (Loss) | 56.857.487.779 | 13.4 | 70.503.618.745 | 15.5 | 24 |
| Profit from Activities (Loss) | 25.312.025.810 | 6.0 | 36.435.407.002 | 8.0 | 43.9 |
| Pre-financing Profit (Loss) | 34.912.777.647 | 8.2 | 43.973.943.485 | 9.7 | 26.0 |
| Financing Costs | 8.623.688.190 | 2.0 | 19.185.235.226 | 4.2 | 122.5 |
| Term Profit (Loss) | 24.192.614.280 | 5.7 | 22.137.110.941 | 4.9 | -8.5 |
We can see this clearly in some of the baseline tables of the Top 500 Industrial Enterprises. When we look at the basic items we see that in 2013 the total sales of the companies have reached up to some 455 bn TRY with an increase of 7.4%, in return for which, the gross profitability that they have attained has risen up to 503 million TRY by increasing by 24%.
We see a good performance when we look at their profit from activities. Because there is 2 pt increase in this profitability in contrast with the previous year. The profit from activities that was 6 % in 2012 has risen to 8% in 2013. Yes, here it seems that there is a recovery in profit from activities because when we look at net sales we can see an increase, which is only neck-to-neck with inflation. That is to say that there is not a considerable increase on the real basis.
At this point, the first thing that comes to one’s mind is that there is an increase based on productivity. Yet, we must say right away that this is not the real reason. We believe this to emerge from the import, especially of import-based raw materials with low rates before the fluctuation and the entailing positive repercussions on prices, hence on income grids.
Now, we would like to share with you another one of the most remarkable features of the 2013 charts.
Our industrial companies have used half of their profits from their main activities for their financing costs. The Top 500 Industrial Enterprises with their profit from activities, which is some 36.5 bn TRY in 2013 have lost more than half thereof –i.e. 19 bn TRY- to financing costs.
The cost of a mere 6 months of financial instability in 2013 is obvious. Moving on with the same figures, it can be seen that they had given only 8.6 bn TRY out of their 25-bn profit from activities to financing costs in 2012.
As a result, the 2013 term-profit of the industrial enterprises that have reaped a profit of around 8% from their activities has been reduced by half, receding as low as 4.9% because of this cycle.
Variations in Baseline Indicators (%)
| 2012 | 2013 | Variation (%) | |
| Net sales | 423.612.059.525 | 454.990.900.780 | 7.4 |
| Exports (Thousand TRY) | 63.712.230 | 63.297.877 | -0.7 |
| Term-profit and loss total (BT) | 24.192.614.270 | 22.137.110.941 | -8.5 |
| Profit before interest depreciation and tax | - | 49.959.617.911 | - |
| Total debts | 189.948.762.522 | 238.276.845.955 | 25.4 |
| Short term debts | 123.406.397.004 | 151.172.585.457 | 22.5 |
| Long term debts | 66.542.365.518 | 87.104.260.498 | 30.9 |
| Financial debts | 95.536.056.116 | 123.946.199.943 | 29.7 |
| Equities | 169.534.357.163 | 179.900.167.083 | 6.1 |
| Actives (assets) total | 359.483.119.718 | 418.177.013.053 | 16.3 |
| Paid interests | 4.641.561.818 | 6.160.506.336 | 32.7 |
This situation in a sense has negatively affected all balances of industrial enterprises. Especially the Top 500 Industrial Enterprises; I wish to draw your attention to the deterioration of their data demonstrating the relation of debts and equities.
However before moving into this matter, I wish to share with you a novelty that we have incorporated just this year to our methodology of evaluating corporate data.
Today, during the evaluation of financial indicators ‘FAVÖK,’ or the EBITDA in international terms, demonstrating the earnings of establishments before interest, tax, depreciation and amortization.
With this indicator, which, in contrast with its current popularity, was not heeded much in the past; we will be making an evaluation of the Top 500 Industrial Enterprises. As it can also be seen on the chart, this year’s data for our companies is around 50 bn TRY.
The Debt/Equities Ratio of the Top 500 Industrial Enterprises
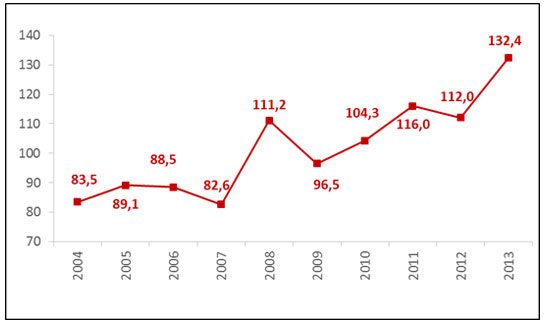
Going back to the baseline indicators of the companies… I wish to draw your attention to the deterioration of the total debts/equities ratio. This ratio, just in 2013, has risen by 20.4 pts. reaching up to 132.4%. In the rapid growth environment of 2011 it had risen up to 116% receding back to 112% in 2012 has reached the peak of the last decade in 2013.
Slow-down of the profitability and equity creation possibilities and the contrasting possibility of long-term borrowing has caused this ratio to rise; which is also affected by the increase of the TRY corresponding to the FX debts following the devaluation of the TRY. However, despite this impact, the level that this ratio has attained is considerably high. Let me remind you that the very same ratio in developed countries is around the level of 70s.
That this ratio is so high constitutes a risk regarding the structure of resources. Because the widening gap between debt and equities negatively affects the financial structure and profitability of the companies in the event of increasing rates and interest just like we have seen in 2013.
Looking into the results of the research, it is seen that the debts of the Top 500 companies have also increased. Total debts that were close to 190 bn TRY in 2012 have risen by 25% in 2013 reaching 238 bn TRY. The short-term portion of these debts has increased by 22.5% and the long-term portion by 30.9%.
This data reveals a bleak picture considering the financial structure of the companies.
On the same track, industrial enterprises have failed in the creation of sufficient internal resources so as to increase their activities and equities. As a result of this, an increase of about 30% was seen in their financial debts and they have closed the year 2013 with a financial debt of 124 bn TRY.
In an environment where internal savings have gone down to around the level of 12%, the companies have turned abroad for this borrowing; hence the significant increase in their foreign borrowings.
Although industrial enterprises have increased their turnover they are steering through considerable hardships regarding profitability this data shows.
The Link Between Debt/Equity for the Top 500 Industrial Establishments
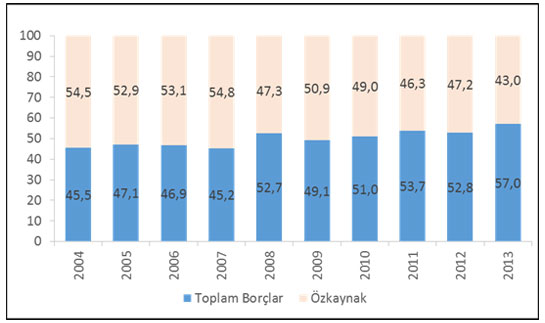
And the share of total debts within the total of actives clearly reveals the financing burden that the industrial sector is in. As it can be seen clearly from the chart, the very same fact is still valid for the ICI Top 500 Big Industrial Enterprises.
The share of the total debts within the total of actives for the Top 500 has risen up to 57% from 52.8% in 2013. The borrowing rate for the Top 500 Big Industrial Enterprises has continued its upward trend, reaching to its peak for the last ten years. This in turn, is important as it demonstrates that the industrial enterprises especially use borrowing resources as a result of insufficiency of their equities.
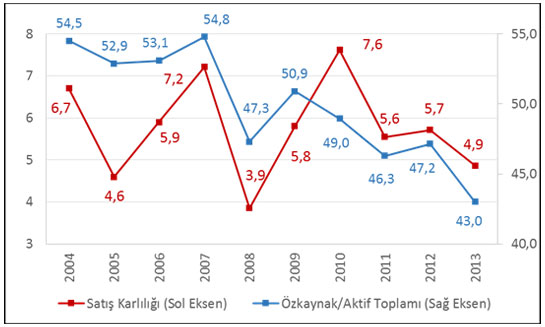
Profitability of Sales and Total of Equities/Actives for the Top 500 Big Industrial Enterprises
Unfortunately however, our industrial enterprises cannot ensure this borrowing from stout resources. This shows us, as a result, that our industrialists mostly prefer bank loans for borrowing instruments and that their financing costs increase in quite an unplanned fashion. Decreased profitability as a result of increased financing costs has, in return, negative impacts on the growth of the companies’ equities.
We must, at this point, say that the rate of 50% as the share of equities within total actives is a critical threshold. In developed countries and especially in those where the capital market operates more efficiently the rate of equities go as up as between 60-70%.
As it can be seen on the graph, the profitability rate which was 7.2% in 2007 receded to 4.9% in 2013 whereby the ratio of equities to actives has receded to 43% from around 55. This ratio is the lowest since 10 years. Decreasing profitability and equities lead to decelerated auto-financing of companies and use of more and more foreign resources.
As a result, in 2012 the financing costs that the ICI 500 companies have paid equated 34% of the profit from activities and this figure in 2013 has risen up to 53%. This is indicative of the fact that more than half of the profits that the companies make are paid as financing costs.
One of the most important reasons at the origin of this situation is, as I said above, the companies monotonously prefer bank loans for their borrowings instead of going for other borrowing tools such as bonds, notes, public offerings, long-term financing and hedging. They prefer to survive on bank-based borrowings. It is unfortunate that our industrial companies with their successful performance in their respective sectors fail to achieve the same success in securing and using finances.
At this point, I wish to emphasize that the Development Bank of Türkiye must be rendered more functional so as to design tailor-made financing solutions to fit the industrialists’ investments. This is needed.
However, global companies who are competitors of the Turkish companies make more use of financing tools other than bank loans. The share of products such as bonds and notes in the debts of Turkish companies is close to 0% whereas this figure can go as up as 15% in the case of global companies.
Establishments in Profit/Loss
| TOTAL OF TERM PROFIT AND LOSS (BT) | ||
| Profit (Qty.) | Loss (Qty.) | |
| 2004 | 419 | |
| 2005 | 406 | |
| 2006 | 420 | |
| 2007 | 450 | |
| 2008 | 352 | |
| 2009 | 412 | |
| 2010 | 434 | |
| 2011 | 380 | |
| 2012 | 337 | |
| 2013 | 471 | |
| PROFIT BEFORE INTEREST DEPRECIATION AND TAX | ||
| Profit (Qty.) | Loss (Qty.) | |
| 2013 | 468 | 32 |
When we take a look at the profitability of the Top 500 Big Industrial Enterprises in 2013, it is seen that the number of companies that have seen the close of the year in profit has decreased considerably.
The number of enterprises among the Top 500 that have made profits in 2013 has gone down to 371 from 437 and the number of those in loss has increased to 129 from 63. Leaving aside the extraordinary conditions that have entailed in the wake of the global crisis of 2008, this is the very first time that we are face to face with such a high number of companies in loss in the last ten years.
As we said above, as a result, especially, of the increase in the interest and foreign exchange rates that cause the financing costs to go up, the number of enterprises making profit/incurring losses as well as the total profitability rates are negatively affected.
It is seen looking at the data based on EBITDA in 2013, which is one of the criteria that went in our evaluations this year, that, the number of companies incurring losses is seen to have dropped to 32 from 129. This indicative of the fact that the profitability of industrial enterprises decrease as a result not of their main activities but under the influence of their financing costs.
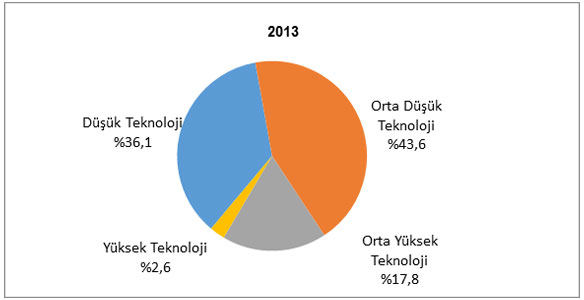
Distribution of Added Value Generated On the Basis of Technology-Intensity (%)
There is yet another important issue that we have included in our scope this year that we wish to inform you about.
In this data set where the added value on the bases of tech-intensity is studied we see that the value added that we can generate with technology is, unfortunately, not satisfactory. The highest value added among the Top 500 Industrial Enterprises comes from mid-low tech-intense group of industries with 43.6%, followed by low-tech-intense group of industries with 36,1%. The share of mid-hi tech-intense group of industries is 17.8%. The 2.6% share of the hi-tech-intense group of industries on the other hand, as low as it is, speaks for itself.
At this point I would like to remind you that the share of hi-tech-intense sectors within the global manufacturing industry is an average of 16.7%. this figure in South Korea is 21.6%, 45.1% in Taiwan, 49.9% in Singapore, 30.0% in Israel, 25.7% in Ireland, 20.6% in the USA and 11.2% in Malaysia.
Türkiye must transform these figures in favor of technology. Otherwise we will not be able to change this landscape and its reflection on industry in terms of profitability.
Looking at these data we can say that industry in Türkiye needs to evolve into high value added and hi-tech sectors. However, as the share of value added generated by the hi-tech companies among the Top 500 is stuck at 2,6%, we are obliged to do a lot more in this direction.
Again, when we look at the profitability of the companies that are on the Top 500 list in terms of their tech-intensity, it is seen that the EBITDA margin of hi-tech industries in 2013 was an average of around 13% whereas the same number for the total of the manufacturing sector within the scope of the Top 500 is 9.4%. In order for the Turkish industry to improve and attain higher levels of profitability, investments in hi-tech-intense industries must be focused on, incentives provided by the state must be made use of and further incentives for investments that are to be made in this are must be provided.
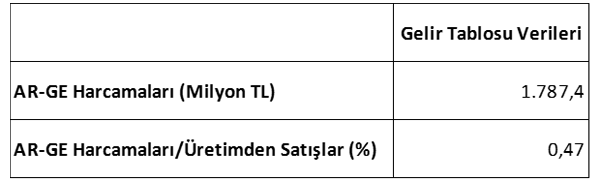
R&D Expenditures
I want to emphasize in bold that this road that leads to hi-tech runs through R&D and innovation.
The world is going through the age of information at hi-speed. Today, the asset value of companies that have turned to innovation and products with high added value, and their profit rates are skyrocketing.
For this reason the ratio of R&D expenditures to sales is a very much important comparison criterion. When international examples are considered it is seen that the ratio of R&D expenditures to sales in industrialized countries go as up as 6-8%.
This ratio in Türkiye is 8 per thousand. That is to say, our Top 500 companies score below Türkiye’s average. Our companies allocate only 47 per thousand of their sales from production to R&D.
Yet, if you are making decisions into the future you must not do so leaving sciences, technology and R&D aside. Even more so, if it is industry that our conversations evolve around, if we are talking about production there is no end to underlining this issue in bold.
Number of Employees in Private Enterprises, Salaries and Fees Paid
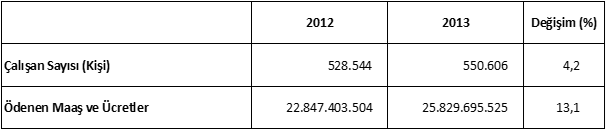
Finally we must say that on the one hand as our industrialists grapple with a lot of problems for survival, on the other hand they provide us with the greatest input for social welfare as they increase their employment even at times of direst economic bottlenecks and raise the salaries of their employers well-above the level of inflation. This means that our industrialists’ way of doing business does not include cuts from employment or from salaries and fees.
This can be best seen in the increasing number of employees in the private sector and the raise of fees by 4.2% and 13.1% respectively.
Top 10 Industrial Enterprises of the Year 2013
| 2013 ranking | 2012 ranking | Name of Enterprise | Public ranking | Private ranking | Sales from production (Net)(TRY) |
| 1 | 1 | Tüpraş | - | 1 | 39.729.407.044 |
| 2 | 2 | Ford Otomotiv | - | 2 | 9.714.212.513 |
| 3 | 5 | EÜAŞ | 1 | - | 9.263.860.001 |
| 4 | 3 | Oyak-Renault | - | 3 | 8.646.831.598 |
| 5 | 4 | Arçelik | - | 4 | 7.790.736.897 |
| 6 | 6 | TOFAŞ | - | 5 | 5.818.911.878 |
| 7 | 9 | İçdaş Çelik | - | 6 | 5.640.701.549 |
| 8 | 8 | Ereğli Demir ve Çelik | - | 7 | 5.265.424.361 |
| 9 | 7 | İskenderun Demir ve Çelik | - | 8 | 5.170.580.044 |
| 10 | 10 | Aygaz | - | 9 | 5.026.095.220 |
Now, we would like to move on with the most anticipated part of the study. Which are Türkiye’s biggest companies?
Starting with the top ten companies, it is not a surprise that Türkiye’s biggest industrial company is Tüpraş. This, anybody can guess. Tüpraş makes best use of its advantage in its own sector and it is well ahead of its competitors with its sales from production of 39 bn 729 million TRY and it is the leader of the Top 500 Industrial Enterprises.
The second to Tüpraş is Ford Otomotiv with 9 bn 714 million TRY worth of sales from production.
The third this year is a new company Electricity Generation Inc. (EÜAŞ), last year’s fifth occupies the third place this year. Electricity generation Inc. as the sole public enterprise that made it to the first ten of the Top 500 has a net sales from production figure of 9 bn 263 million TRY.
Fourth on the list is yet another automotive company; Oyak-Renault who has dropped one rank since last year with a sales from production of 8 bn 646 million TRY.
Arçelik with the recent years’ success in the field of white goods is also among the first ten companies with sales from production of 7 bn 791 million TRY. It ranks the fifth.
Automotive sector is Türkiye’s pioneer and the sixth company is another automotive company, TOFAŞ holding onto last years’ place with 5 bn 819 million TRY.
Now we have three industrial companies, one after the other, as the representatives of the steel and iron sector. Among them, İçdaş with a sale from production of 5 bn 641 million TRY rising to the seventh place from two below last year.
Then, with a sale from production of 5 bn 265 million TRY comes Ereğli Demir Çelik in the eight place among the Top 500.
At the ninth place is another steel and iron company, İskenderun Demir Çelik with a sale from production of 5 bn 171 million TRY.
And the tenth is another petrochemical company, just like Tüpraş; Aygaz with a sale from production of 5 bn 26 million TRY.
It is evident that despite changing places in the last year’s ranking among the top ten companies, the companies in the list have not changed. The competition among the top ten of the industry is still among petrochemicals, automotive and steel and iron sectors. Yet, the biggest novelty here, as we have said above, is the Electricity Generation Inc. that has climbed up two places and made it among the first three.
The 10 Most Profitable Industrial Enterprises of 2013
| 2013 ranking | 2012 ranking | Name of Enterprise | Public ranking | Private ranking | Pre-tax Profit or (Loss) for the Period |
| 1 | 12 | EÜAŞ | 1 | - | 2.569.101.706 |
| 2 | 1 | Türkiye Petrolleri Anonim Ortaklığı | 2 | - | 1.634.198.676 |
| 3 | - | - | - | - | - |
| 4 | 5 | Eti Maden İşletmeleri | 3 | - | 841.797.606 |
| 5 | - | Mercedes-Benz Türk | - | 2 | 805.507.329 |
| 6 | - | Philsa Philip Morris | - | 3 | 760.649.785 |
| 7 | 7 | Tüprag Metal Madencilik | - | 4 | 669.449.075 |
| 8 | 6 | Koza Altın İşletmeleri | - | 5 | 543.281.929 |
| 9 | 63 | Soda Sanayii | - | 6 | 523.414.008 |
| 10 | 16 | Eti Bakır | - | 7 | 442.907.145 |
As the top ten companies in terms of sale from production remained unchanged, when it comes to profitability the picture starts to shift. Whereas among the top ten most profitable companies of 2012 were two companies operating in the public sector, this number has increased in 2013, by one. And this is open ended as three out of four profiting companies are public entities.
Also, what really catches the eye in this ranking is the bleak presence of manufacturing industry companies among the profiting champions. With the exception of a company that prefers to remain unanimous, only three out of 9 companies, namely, Mercedes, Philip Morris and Soda Sanayii are there to represent the manufacturing industry. Others belong to energy and mining. What is ironic here is the fact that the profits of these companies come from the energy sector, which is the most basic input of industry.
This year we thus see two energy-based public industrial companies occupying the top two places. Electricity Generation Inc. that came the 12th the year before takes the first place with a profit of 2 bn 569 million TRY whereas Turkish Petroleum, the champion of 2012, with a profit of1 bn 634 million takes the second place.
As you know, the companies that share their information with us for the Top 500 Industrial Enterprises study wish to remain unanimous. So as to keep the coverage of our study as comprehensive as possible we respect this wish and do not publish their entities. This year’s third place holder wanted to remain unanimous; hence its vacant place in the table.
Looking at the remaining places in the ranking, Eti Maden İşletmeleri with its profit of 842 million TRY comes the fourth; Mercedes-Benz the fifth with a profit of 805 million TRY and Philip Morris the sixth with a profit of 761 million TRY followed by two mining companies with profits of 669 and 543 million TRY respectively; Tüprag Metal and Koza Altın.
Soda Sanayii A.Ş. working in the chemicals sector comes the ninth with a profit of 523 million TRY and this for the company is a breakout in comparison with the year before. Another mining company, Eti Bakır is the 10th place holder of the 2013 ranking with a profit of 442 million TRY.
10 Biggest Exporters of 2013
| 2013 ranking | 2012 ranking | Name of Enterprise | Public ranking | Private ranking | Exports ($ 000) |
| 1 | 1 | Tüpraş | - | 1 | 4.118.062 |
| 2 | 2 | Ford Otomotiv | - | 2 | 3.696.202 |
| 3 | 3 | Oyak-Renault | - | 3 | 3.523.398 |
| 4 | 5 | Tofaş | - | 4 | 2.166.629 |
| 5 | 4 | Arçelik | - | 5 | 2.116.878 |
| 6 | 10 | Toyota Otomotiv | - | 6 | 1.662.557 |
| 7 | 6 | Vestel Elektronik | - | 7 | 1.396.816 |
| 8 | 8 | OMV Petrol Ofisi | - | 8 | 1.012.265 |
| 9 | 7 | İçdaş Çelik | - | 9 | 1.010.814 |
| 10 | 11 | Bosch | - | 10 | 970.585 |
This year we see that there are changes in the performances and the ranking of the top ten exporters.
The first three places remain unchanged; Tüpraş retains its leadership in sales from production as well as the leading exporter with an exports of 4 bn 118 million dollars.
The two companies that follow Tüpraş are Ford Otomotiv and Oyak-Renault with exports of 3 bn 696 million dollars and 3 bn 523 million dollars, respectively.
TOFAŞ is the fourth in this list, followed by Arçelik who has dropped down to the row below this year. Last year’s tenth place holder, Toyota Otomotiv has risen to the sixth place this year. Vestel Elektronik has dropped down by one and is the seventh in the list. OMV Petrol Ofisi remains the eighth, followed by İçdaş. Then comes Bosch, which was the eleventh the last year and managed to make it among the top ten this year.
Looking at the wider picture –the table- we see shrinkage of 7 per thousand in the exports of the Top 500 industrial enterprises in 2013, when compared with the exports of the previous year. If we remember that Türkiye’s overall exports, too has gone down by 4 per thousand in the same time frame, we can easily say that the performance of the Top 500 is parallel to the national trend.
These outcomes include the series of ‘sagas’ full of lessons for the economy pilotage of our country as well as for our companies.
I would hereby like to congratulate all of our industrial companies who have shared their data with us and helped in the realization of this study and wish to underscore the importance of one thing that we always have emphasized; financial stability.
The data and results that I have just shared with you reveal the importance of financial stability for Türkiye’s economy and how critical a threshold this financial stability is. We have seen all together what happens to the financial structures and profitability of our companies even during a minor turbulence. The results thus reveal in all clarity the fact that those to govern Türkiye should never ignore financial stability.
On the other hand, we have also shared with you critical data on technology and R&D. The data from 2013 show us how we lag behind in a field such as technology, which is a must for Türkiye, and which is so indispensable for the upgrade of our industry.
This is something that all those who bear responsibility must think on and act in unison so that Türkiye, our country will proceed towards hi-tech.
Next year, again around this time we hope we will be presenting you with even stronger data on Türkiye’s Top 500 Industrial Enterprises Thank you for your participation.